Hi all,
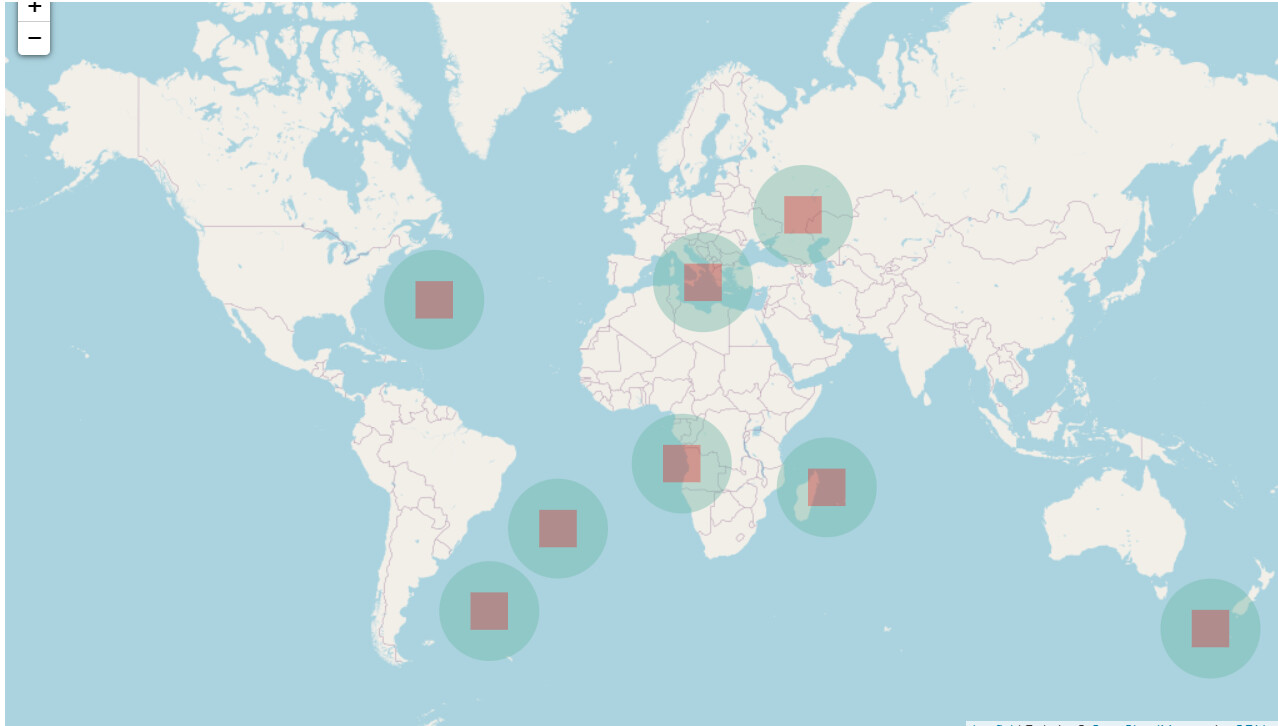
I read the folium.Maker documentation at link (https://www.python-graph-gallery.com/312-add-markers-on-folium-map). As shown in the image below, the shaded circles at the city locations are very nice. But how to show the different size of these circles according to the values, for example large population the circle is larger than cities with low population.
So, could you help me how to show the different size of these circles according to the values in this map?
Best regards,
Van Càn