Dear all,
I want to show the location and name of each city on Map. But it only shows the locations, how to display the name of each location on this Map?

Thank you,
Best regards,
Van Can
Dear all,
I want to show the location and name of each city on Map. But it only shows the locations, how to display the name of each location on this Map?
Thank you,
Best regards,
Van Can
dear Van Can
Thank you for your contribution to the anaconda community.
Read the folium.Maker documentation and you’ll be fine. Detailed documentation is available at the URL below.
https://python-visualization.github.io/folium/modules.html#module-folium.map
If you want to modify your code specifically,
popup = city[‘name’]
of
popup = Popup(city[‘name’], parse_html = True)
If you change it to , it should solve the problem.
In addition, it is a good idea to refer to it as it explains in detail how to use Tooltips.
Best regards
ktsh.tanaka.2020
Dear ktsh.tanaka.2020,
It has an error out. I think that popup is defined before, why is it error? please help.
Van Can
dear vancan.
thank you for your reply.
you wrote at this program
popup = popup(city[‘name’], parse_html = True)
However, according to the folium documentation, it should be:
popup = Popup(city[‘name’], parse_html = True)
Python is case sensitive, so We hope you don’t get it wrong.
Regards, you.
ktsh.tanaka.2020
dear vancan.
thank you for your reply.
Sorry Sorry.
Too bad I didn’t check the correct command spelling. For more information,
class folium.map.Popup(html=None, parse_html=False, max_width=‘100%’, show=False, sticky=False, **kwargs)
Bases: branca.element.Element
Create a Popup instance that can be linked to a Layer.
Parameters
html (string or Element) – Content of the Popup.
parse_html (bool, default False) – True if the popup is a template that needs to be rendered first.
max_width (int for pixels or text for percentages, default ‘100%’) – The maximal width of the popup.
show (bool, default False) – True renders the popup open on page load.
sticky (bool, default False) – True prevents map and other popup clicks from closing.
render(**kwargs)
Renders the HTML representation of the element.
popup = Popup(city[‘name’], parse_html=True)
If so, an error will occur because the folium map is not imported.
Below is the correct answer.
popup = folium.map.Popup(city[‘name’], parse_html=True)
Best regards
ktsh.tanaka.2020
Hi ktsh.tanaka.2020,
But it still doesn’t show the name of cities name on each marker. You can see Figure.
Best regards,
Van Can
dear vancan.
thank you for your reply.
This problem is a near impossible task for me. Maybe if you click on that map’s tooltip, you’ll see the city name.
However, if you want the mode to appear on the base layer, it should use the name that appears on the original layer.
I have only one hint.
That is how to change the tooltip icon to the city name.
The URL below shows how to do this.
Hypothetically, to enable both, change the name of the base layer and display the city name on it using the above method.
Furthermore, I think that the only way to solve this is to display a tooltip.
Thanks for the hard questions.
Best regards
ktsh.tanaka.2020
Hi ktsh.tanaka.2020,
Thank you for your help.
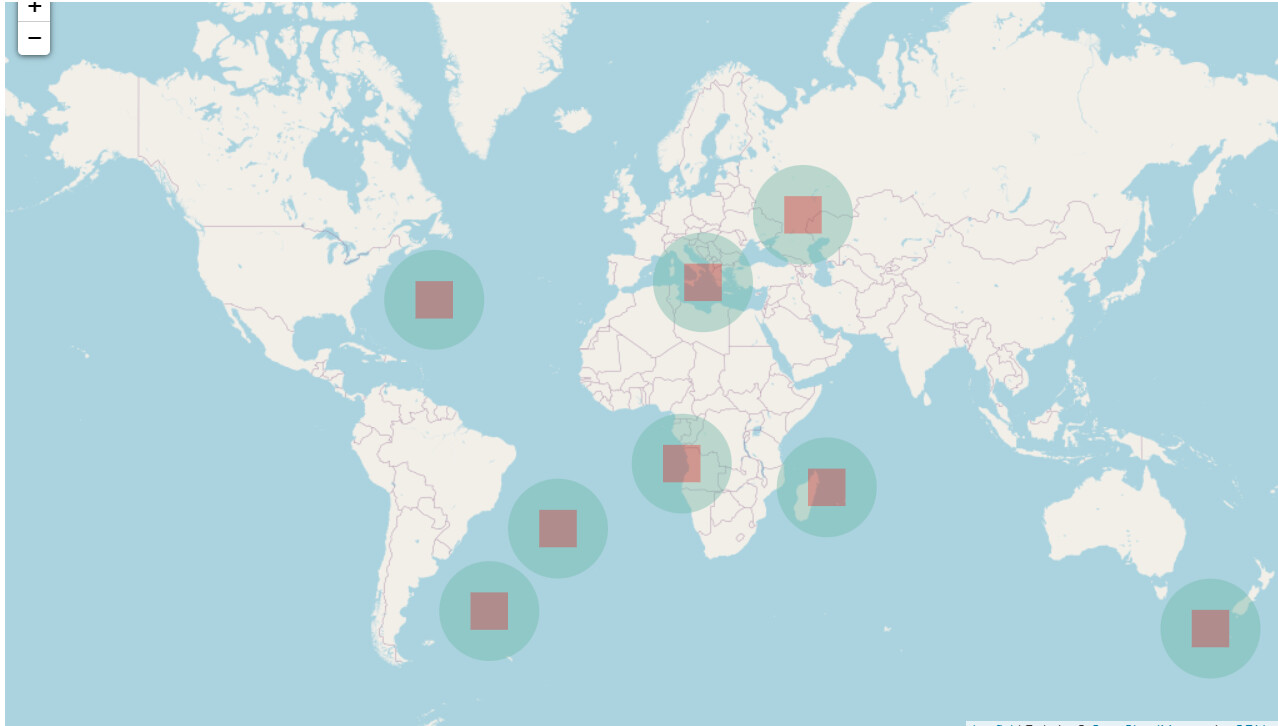
When I saw the link you sent, I really liked the markers example in this link. As shown in the image below, the shaded circles in the city locations are very nice. But how to show the different size of these circles according to the values, for example large population the circle is larger than cities with low population.
So, could you gave me a code example?
Hi ktsh.tanaka.2020,
Thank you for your help.
When I saw the link you sent, I really liked the markers example in this link. As shown in the image below, the shaded circles in the city locations are very nice. But how to show the different size of these circles according to the values, for example large population the circle is larger than cities with low population.
So, could you gave me a code example?