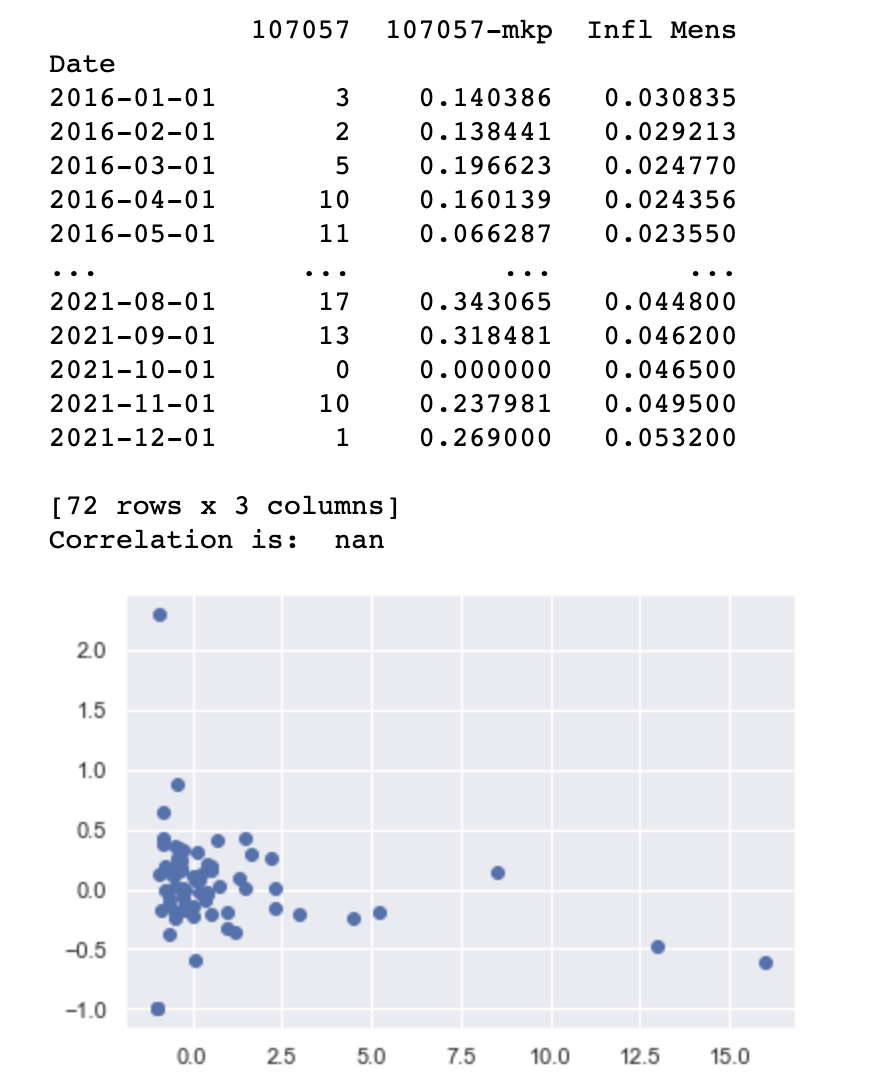
Im running this code to compare these 2 series but the correlation function returns nan:
import pandas as pd
from pandas import Series
%matplotlib inline
from statsmodels.tsa.seasonal import seasonal_decompose
from sklearn.preprocessing import RobustScaler

# Seasonal exploration visualizing ts
import matplotlib.pyplot as plt
import seaborn as sns
import matplotlib.dates as mdates

# Set  of commands to plot 1 column from multiple series on excel file
df=pd.read_excel('DataLSTMReady.xlsx')
df.Date=pd.to_datetime(df.Date)

df=df.set_index('Date')

df=df.iloc[:,[0,1,3]] #df=df.iloc[:,0:4]

print(df)

# COMPUTE CORRELATION BETWEEN TIMESERIES USING pctchange INSTEAD OF LEVELS/VALUES OF EACH
df['107057_Ret'] = df['107057'].pct_change()
df['Infl_Mens_Ret']= df['Infl Mens'].pct_change()
df['107057-mkp_Ret']= df['107057-mkp'].pct_change()

plt.scatter(df['107057_Ret'],df['107057-mkp_Ret'])
plt.show

correlation=df['107057_Ret'].corr(df['107057-mkp_Ret'])
print("Correlation is: ", correlation)

sns.set(rc={'figure.figsize':(11, 4)})
Here are the results: